Video Rental Analytics
I built this Unicorn Academy data bootcamp final project from Sakila and a fictional Blockbuster case, with six views covering sales, stores, costs and online expansion.
- My contribution
- I contributed to the analysis and Power BI reports for the bootcamp final project.
- Who it serves
- An academic video-rental case using the Sakila database.
- Scope
- Six views covering sales, stores, costs, catalog and online expansion.
Case overview
This non-professional final project for Unicorn Academy's data bootcamp was completed in January 2026. The Power BI report connects to a transformed Sakila database in MySQL to analyze sales, costs, stores, geography and catalog.
- Context
- Learning project
- Database
- MySQL / extended Sakila
- Model
- 21 related tables
- Source
- 6 PBIX pages, 63 visuals
Blockbuster · bootcamp Power BI report
Final project for Unicorn Academy's data bootcamp, completed in January 2026. The .pbix works on Sakila transformed in MySQL with 21 tables, 182,326 payments, stores in Barcelona and Valencia, quality costs and a web-migration forecast.
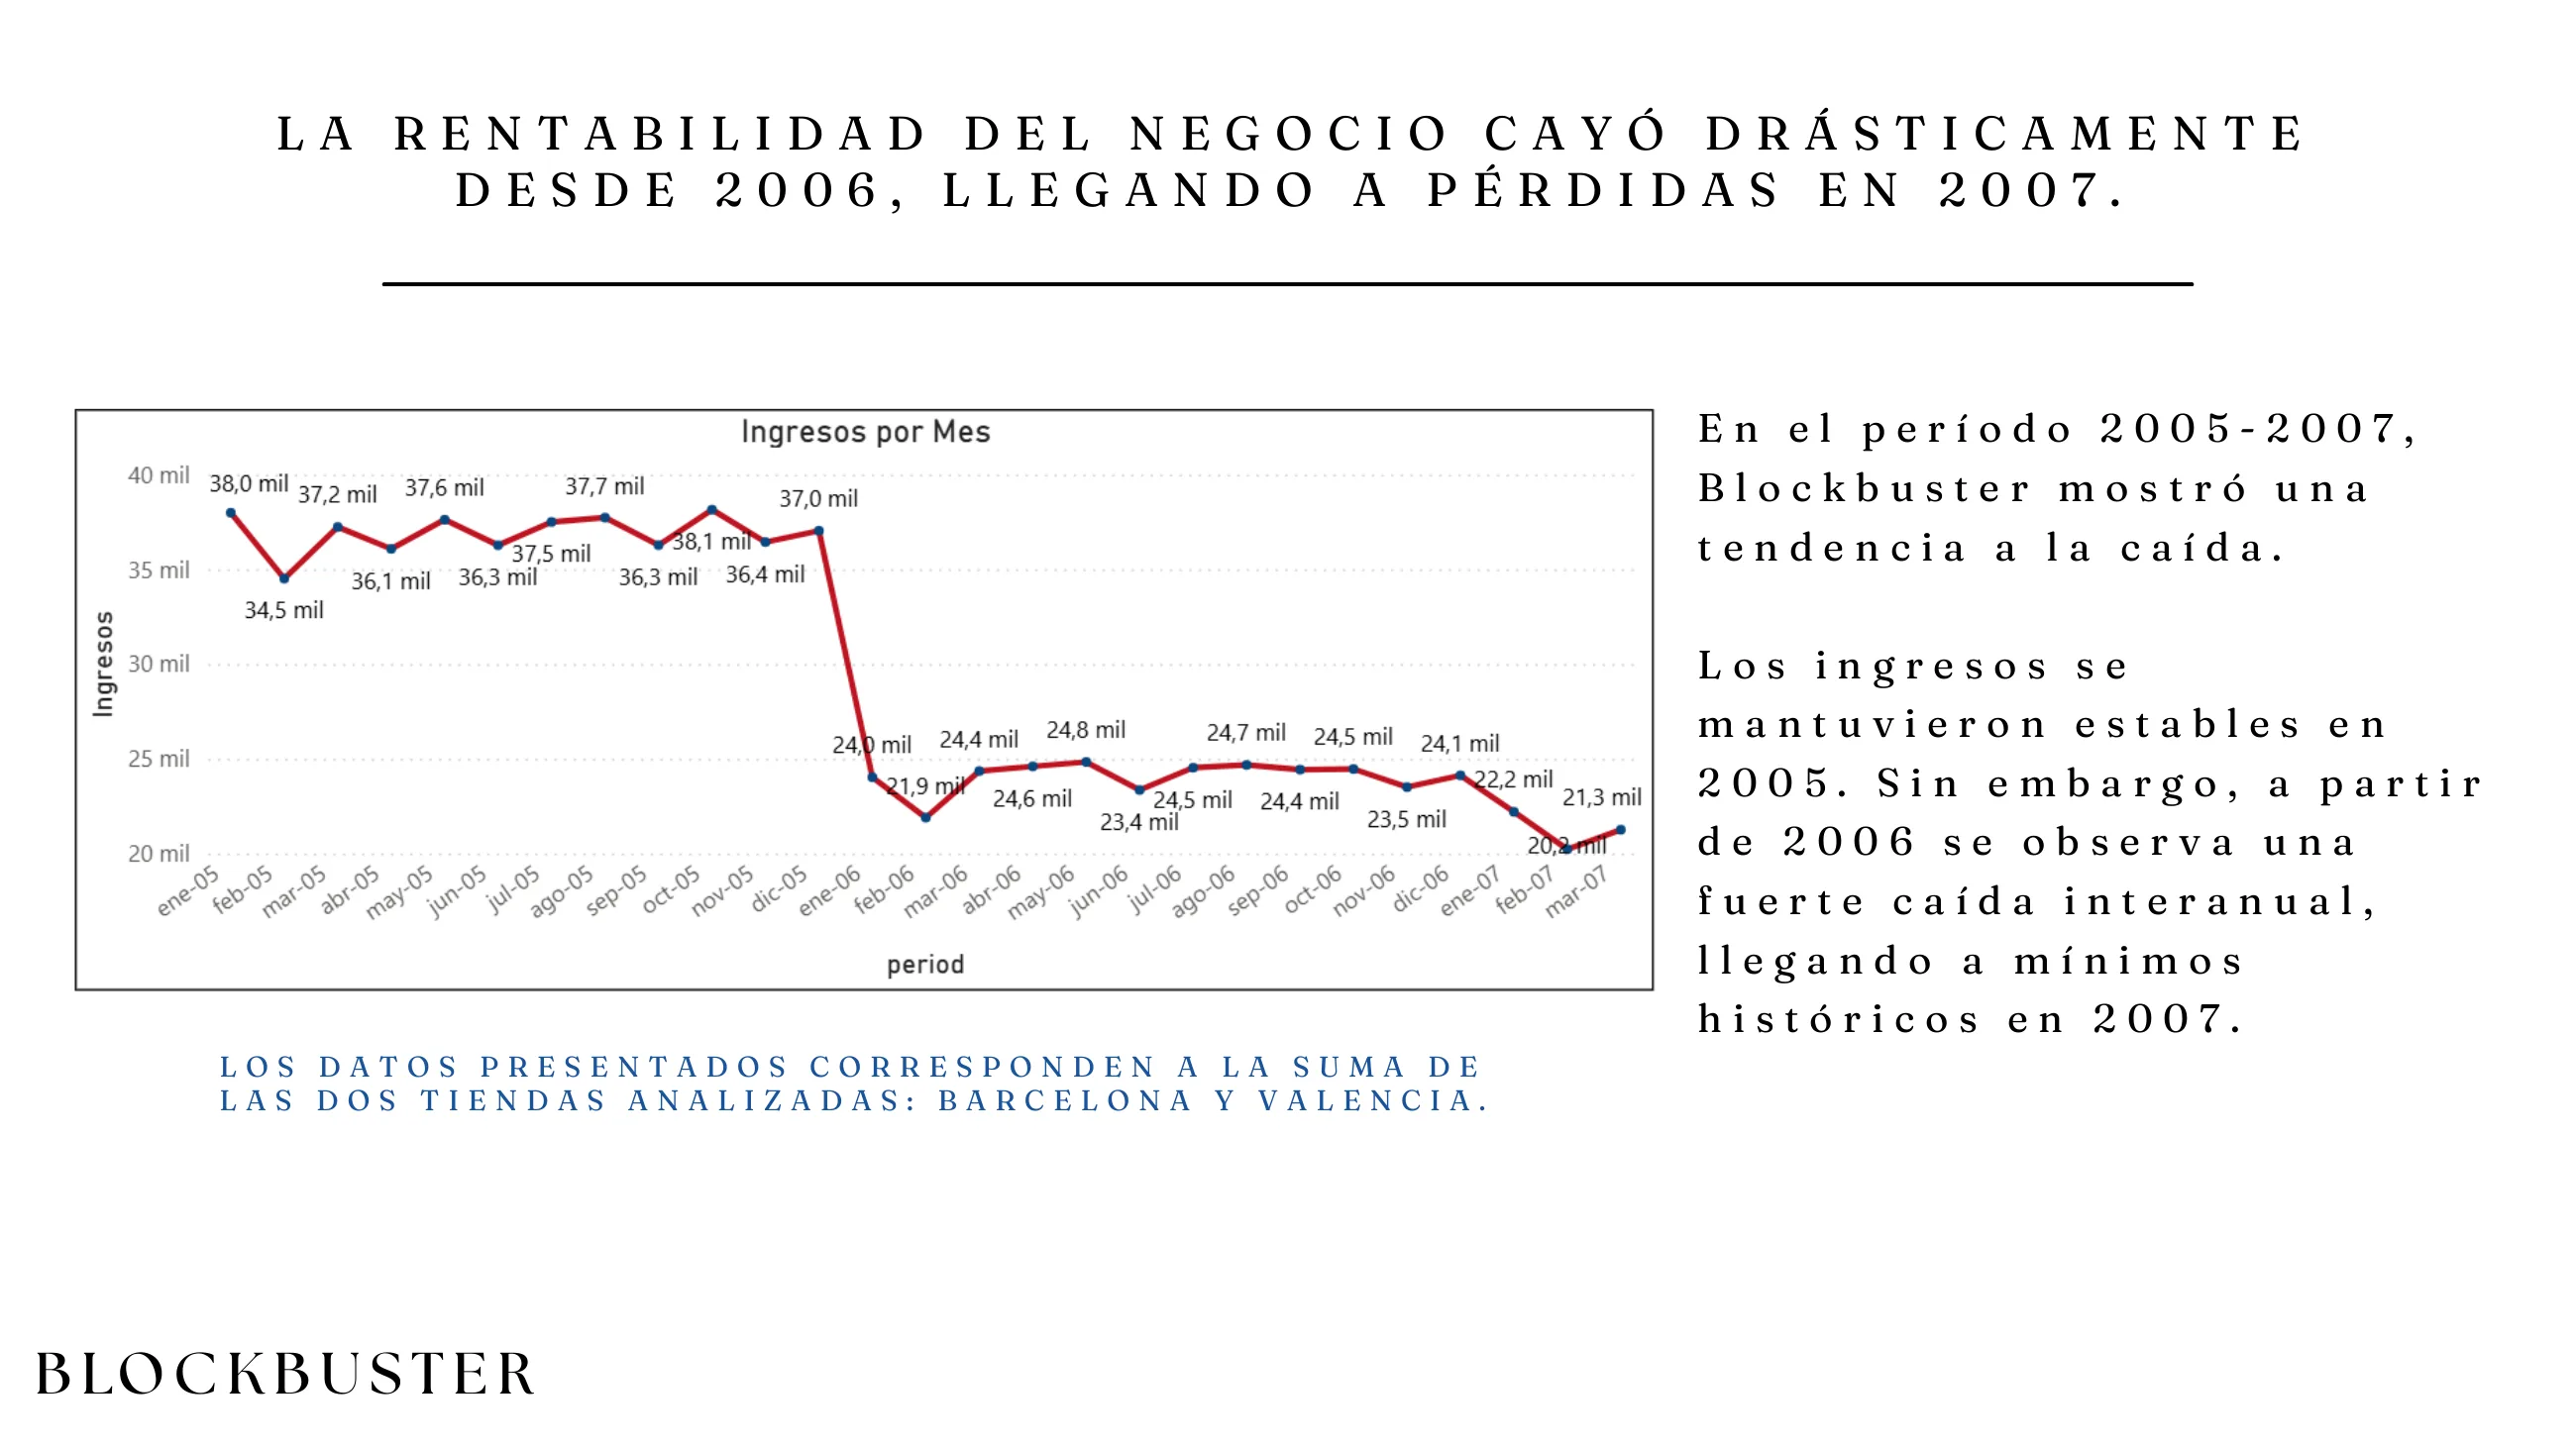
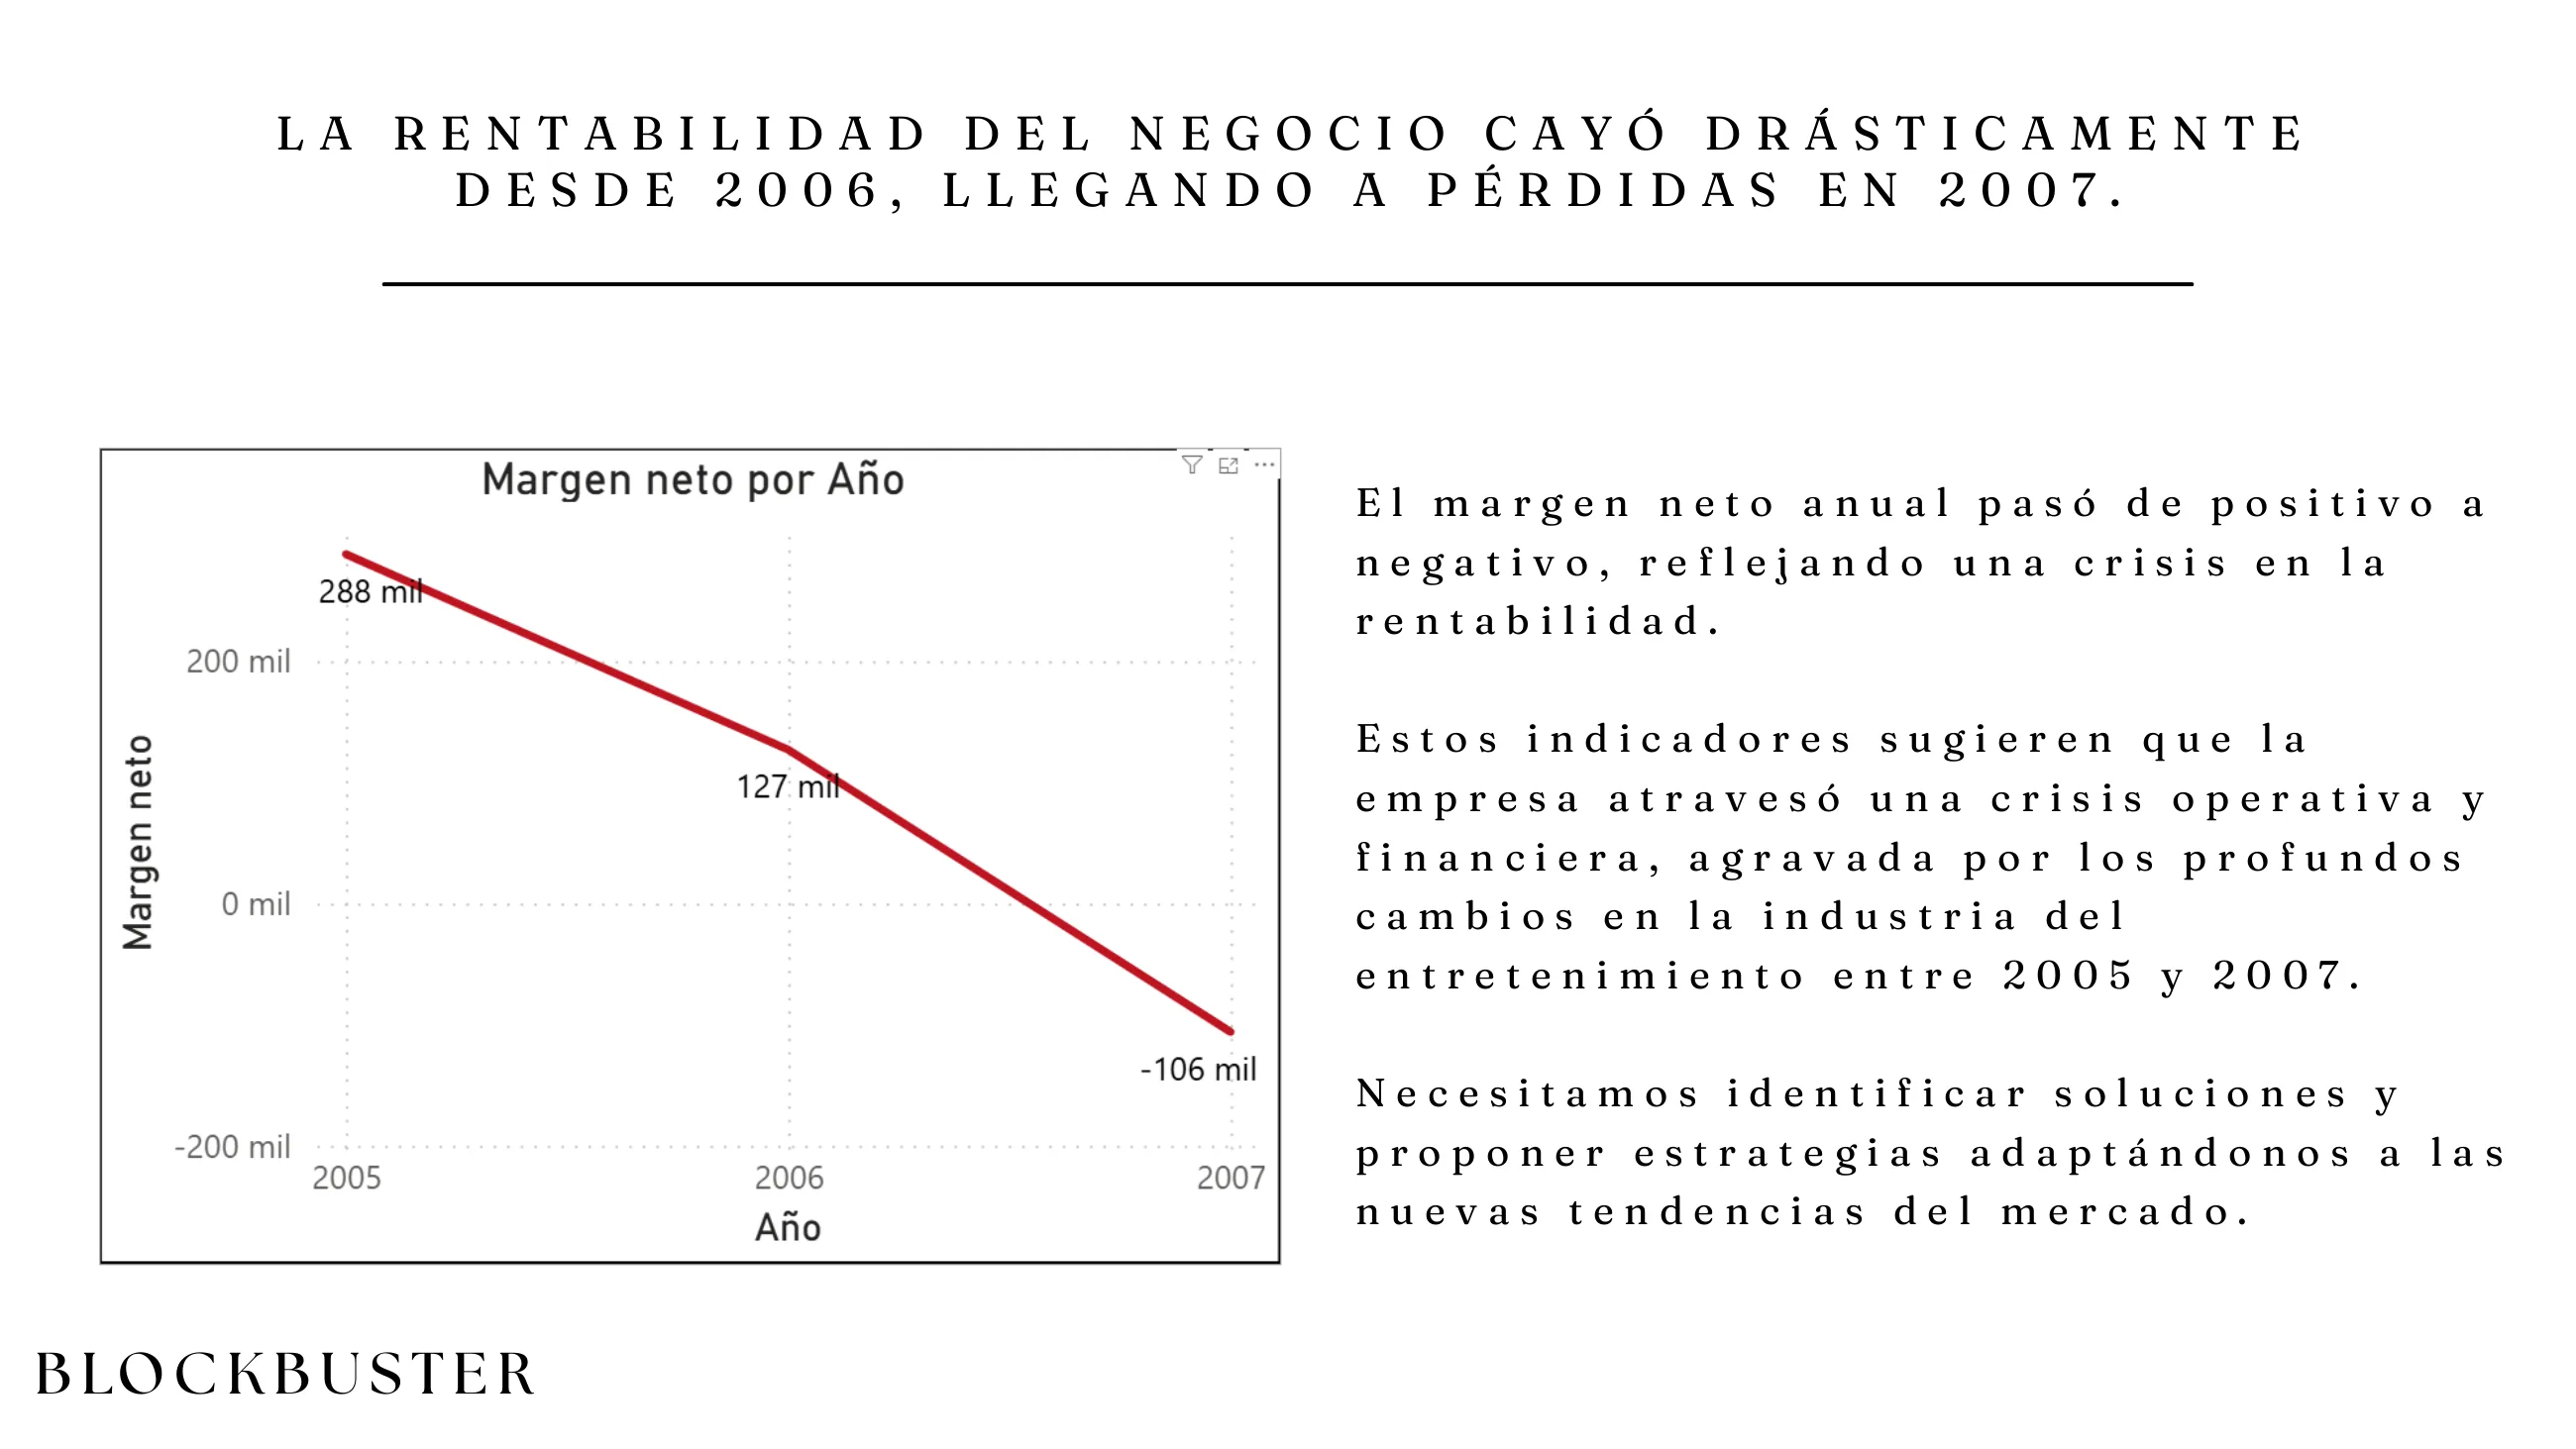
Net margin falls from +€288k to −€106k
Modeled yearly cost rises from €155k to €170k as margin crosses zero in 2007. The team recommended opening the online channel and keeping Barcelona as a showroom.
- Revenue
- €795k
- Payments
- 182,326
- Net margin
- €309k
- Total cost
- €487k
Revenue by Month
Net margin by Year
The six Power BI pages
The replica retains the .pbix slicers, geographic drill, cost model and rankings.
Overview
The report's cover brings together revenue, payments, average payment, net margin and total cost with the real monthly series (Jan-05 to Mar-07) and the yearly margin crossing into losses in 2007. That fall is the question the project answers.
- Revenue
- €795k
- Payments
- 182,326
- Avg payment
- €4.36
- Net margin
- €309k
- Total cost
- €487k
Revenue by Month
Net margin by Year
The original
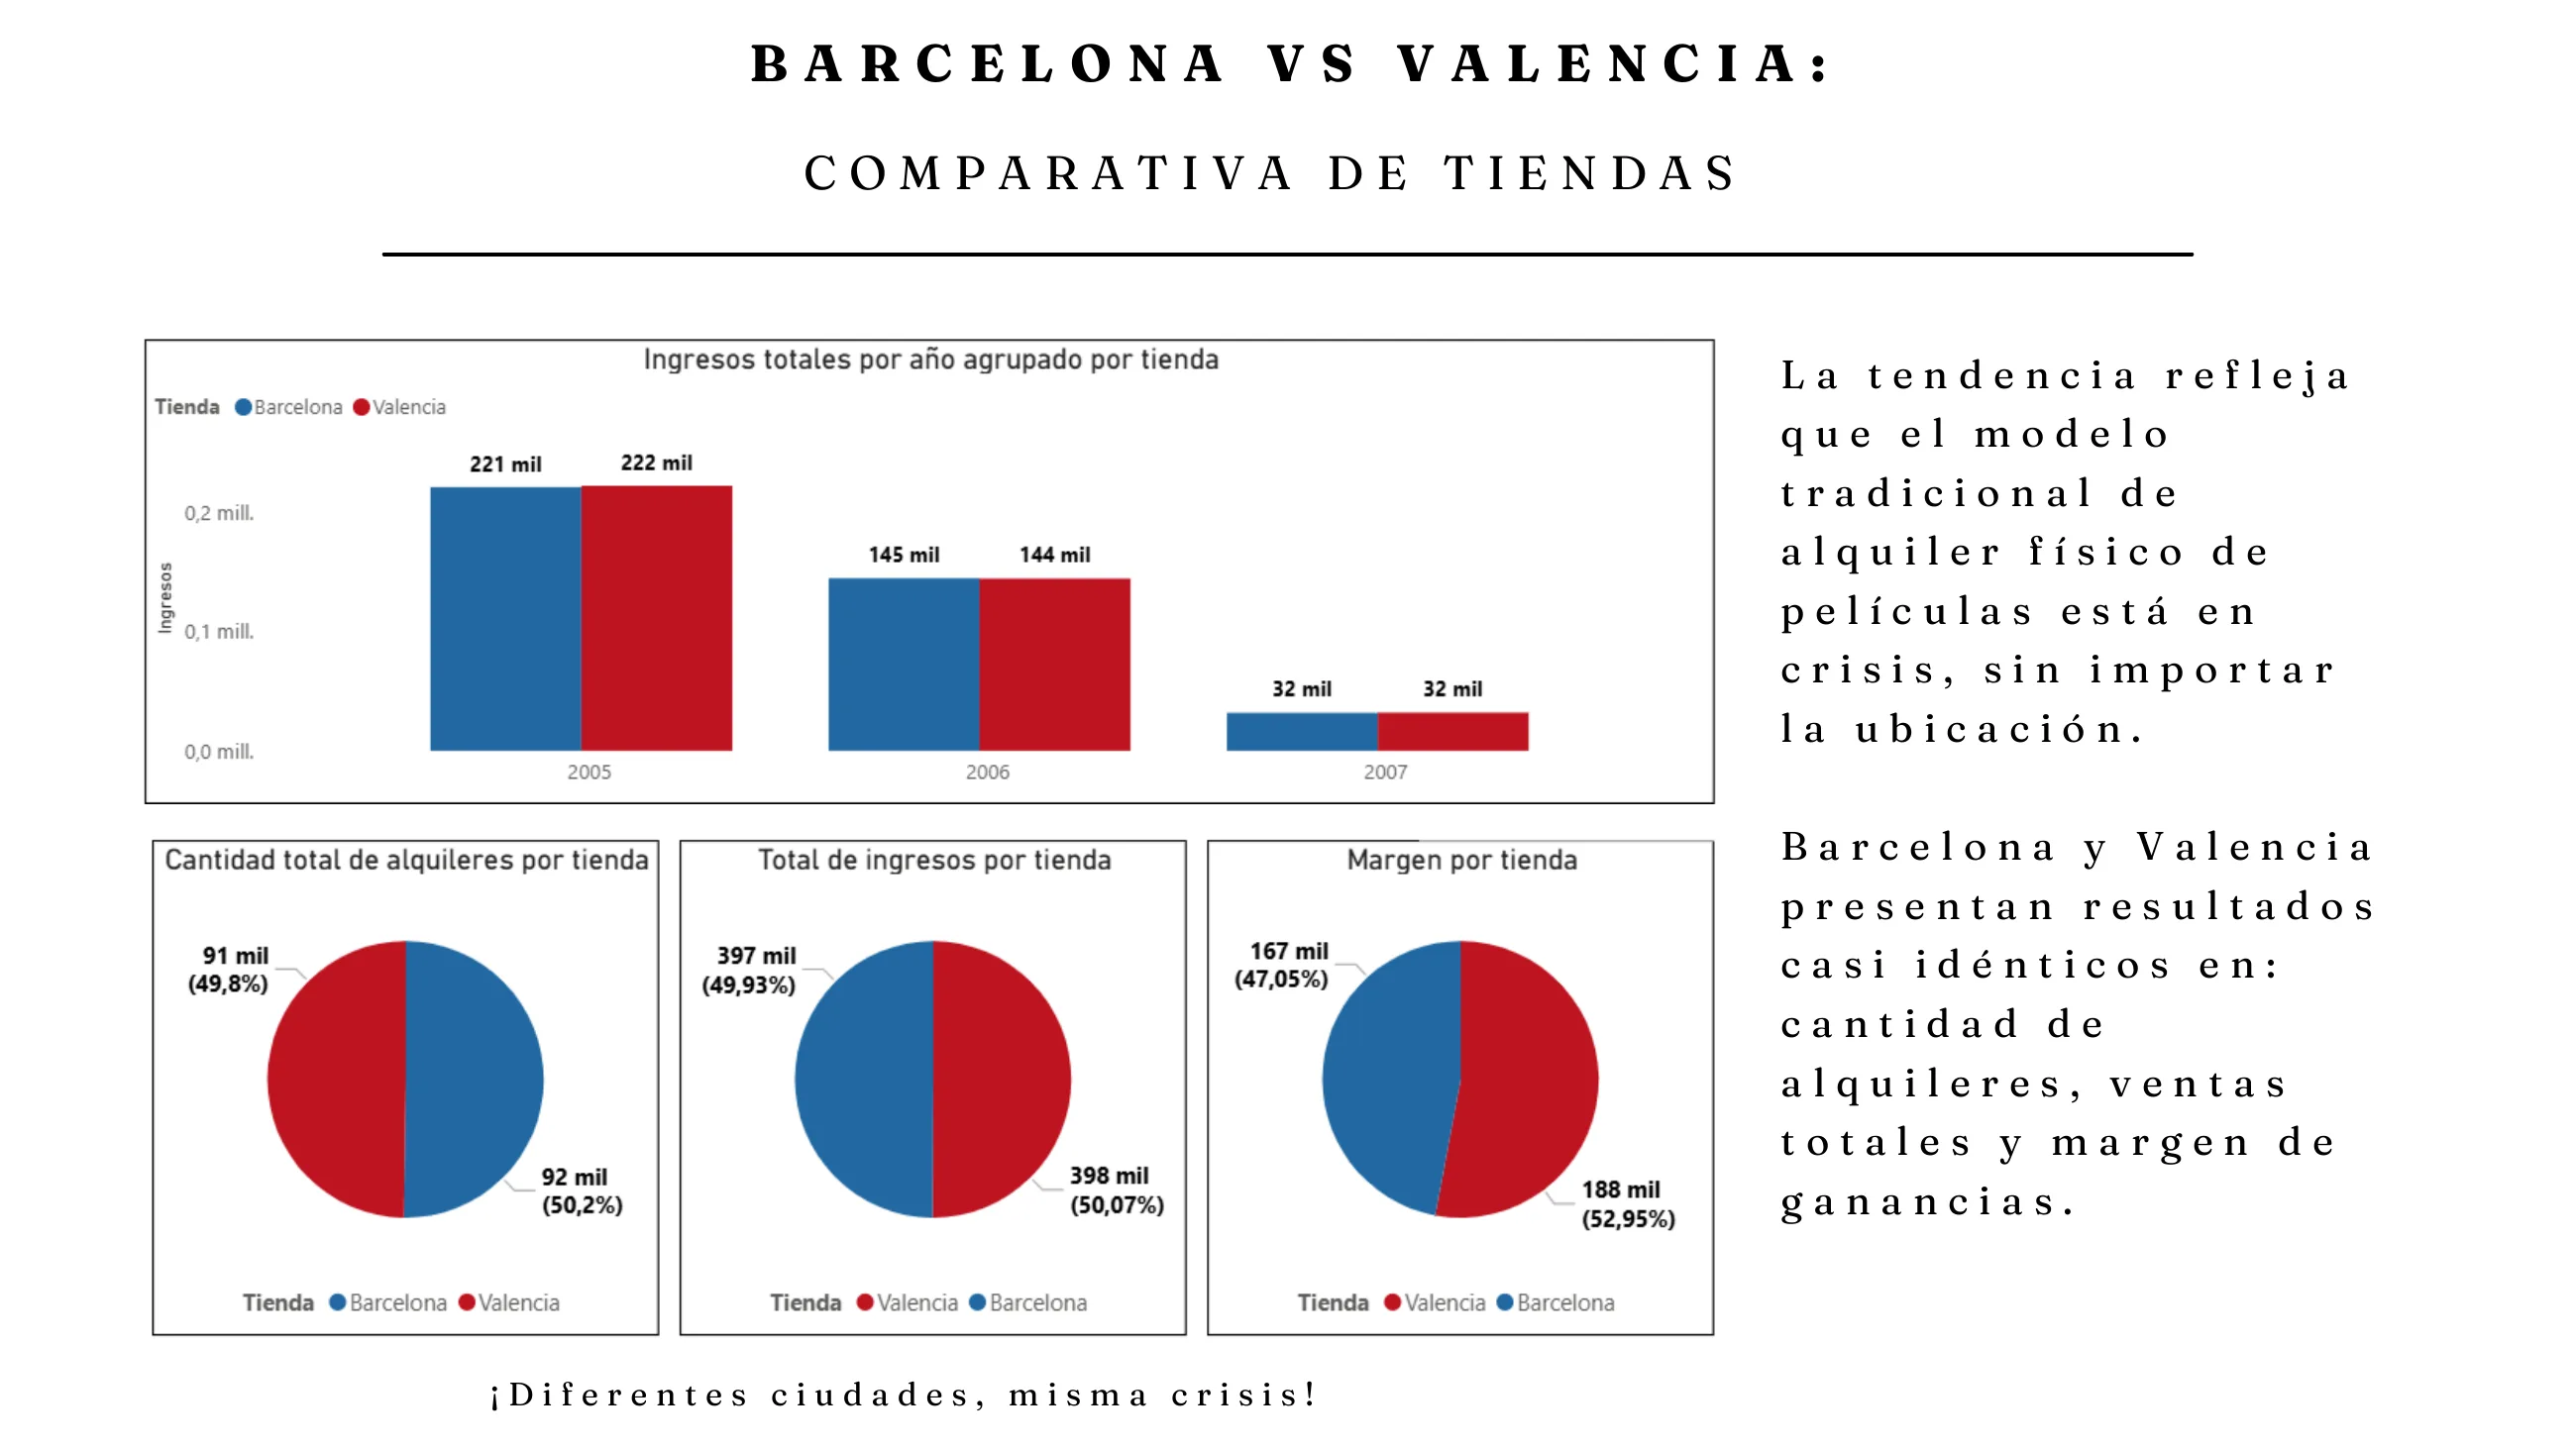
Pages from the bootcamp's final presentation, with the .pbix visuals as they were defended, and the card that sums up the project's question.

Data model
Academic Power BI project on Sakila/MySQL, focused on sales, stores, costs and catalog analysis.
- Context
- Non-professional learning project, final delivery for Unicorn Academy's data bootcamp; a three-person capstone, defended in January 2026
- Story
- Net margin goes from +€288k (2005) to −€106k (2007), so the physical model falls into losses while digital consumption grows
- Recommendation
- Open the online store and keep the Barcelona store as a showroom and contact point, with a forecast of 450/600/750 web titles for 2007-2009
- Report
- 6 pages covering Overview, Geographic analysis, Sales by Store, Cost Analysis, Web Cost Forecast and Audiovisual Rankings
- MySQL model
- Transformed Sakila with payments_v2, rental_v2, inventory, film, customer_v2, address_v2, costs, qualities and online projection
- Data
- 182,326 payments, 1,000 films, 4,581 inventory rows, 2,635 extended customers, 330 postal codes and SD/HD/4K costs
Case decisions
Data model
The project starts from Sakila and extends it with payments, customers, addresses, postal codes, store costs, film quality and online projection. The main chain joins payments_v2, rental_v2, inventory and film, with dimensions for geography, category, actors and quality.
Report
Overview with revenue, payments, average payment, margin and monthly evolution.
Country, city and postal-code geography, recreated as an interactive drill.
Sales by store, physical costs, web-channel projection and rankings for titles, actors, genres and qualities.
Final project
The team delivered six interactive views covering sales, geography, stores, costs, web projections and catalogue performance as the data bootcamp's final project.
Facets
Tools
- Power BI
- 6-page, 63-visual PBIX covering the overview, geography, stores, costs, web projection and rankings
- MySQL / Sakila
- extended database with payments, rentals, inventory, films, customers, addresses, costs and qualities
- DAX
- measures for revenue, margin, volume, quality costs and store comparisons
- Data modeling
- relationships across payments_v2, rental_v2, inventory, film, customer_v2, address_v2, categories, actors and online projection